Wednesday 25 November 2020

Results published in Hydrogeology Journal

The results findings of my MSc thesis and some new updated data from my thesis supervisor Masaki Hayashi were published earlier this year in Hydrogeology Journal in this article: 

Hydrogeological characterization of an alpine aquifer system in the Canadian Rocky Mountains

Follow this link to read the article. It is open-access and free for all to read and download. 

Monday 27 November 2017

Thesis Released to Public

Following my convocation, my MSc thesis is now available to the public. Follow the link below to view and download it.

http://hdl.handle.net/11023/3960

I am currently preparing a manuscript with the intent of publishing part of my results in a peer-reviewed journal. I will post to this blog once that publication is released.

Wednesday 16 August 2017

Thesis Complete - July 2017

Like the Americans, I found my independence on July 4. Last month, I successfully defended my thesis and have come to the end of my Master of Science studies. Here are a few photos of the occasion. I have been enjoying some much needed relaxation, and will spend time on some personal projects before I move on to a full time job starting in early 2018.

At the public presentation preceding the oral examination. 
A little drink to celebrate afterwards. 
This blog will, understandably, be a less active henceforth, but I will periodically post some updates. My thesis will be publicly available in November, but I might be able to share a copy with you directly. I intend to prepare at least one and possibly two journal articles related to my work at Fortress Mountain. Moreover, other researchers and former colleagues will continue to work at this site and in similar ones throughout the Rockies. I will update if there are significant developments on those fronts.

Until then, traveller of the world wide web, enjoy this archive of photos, field work stories, and scientific musings!

-- Craig


Tuesday 25 April 2017

Approaching the light at the end of the tunnel

I've spent the last few months with the blinders on, focused on writing the thesis. I'm about 7-10 days away from finishing the first draft, and taking a moment to finally update this blog. Here are a few things I've been up to since the fall.

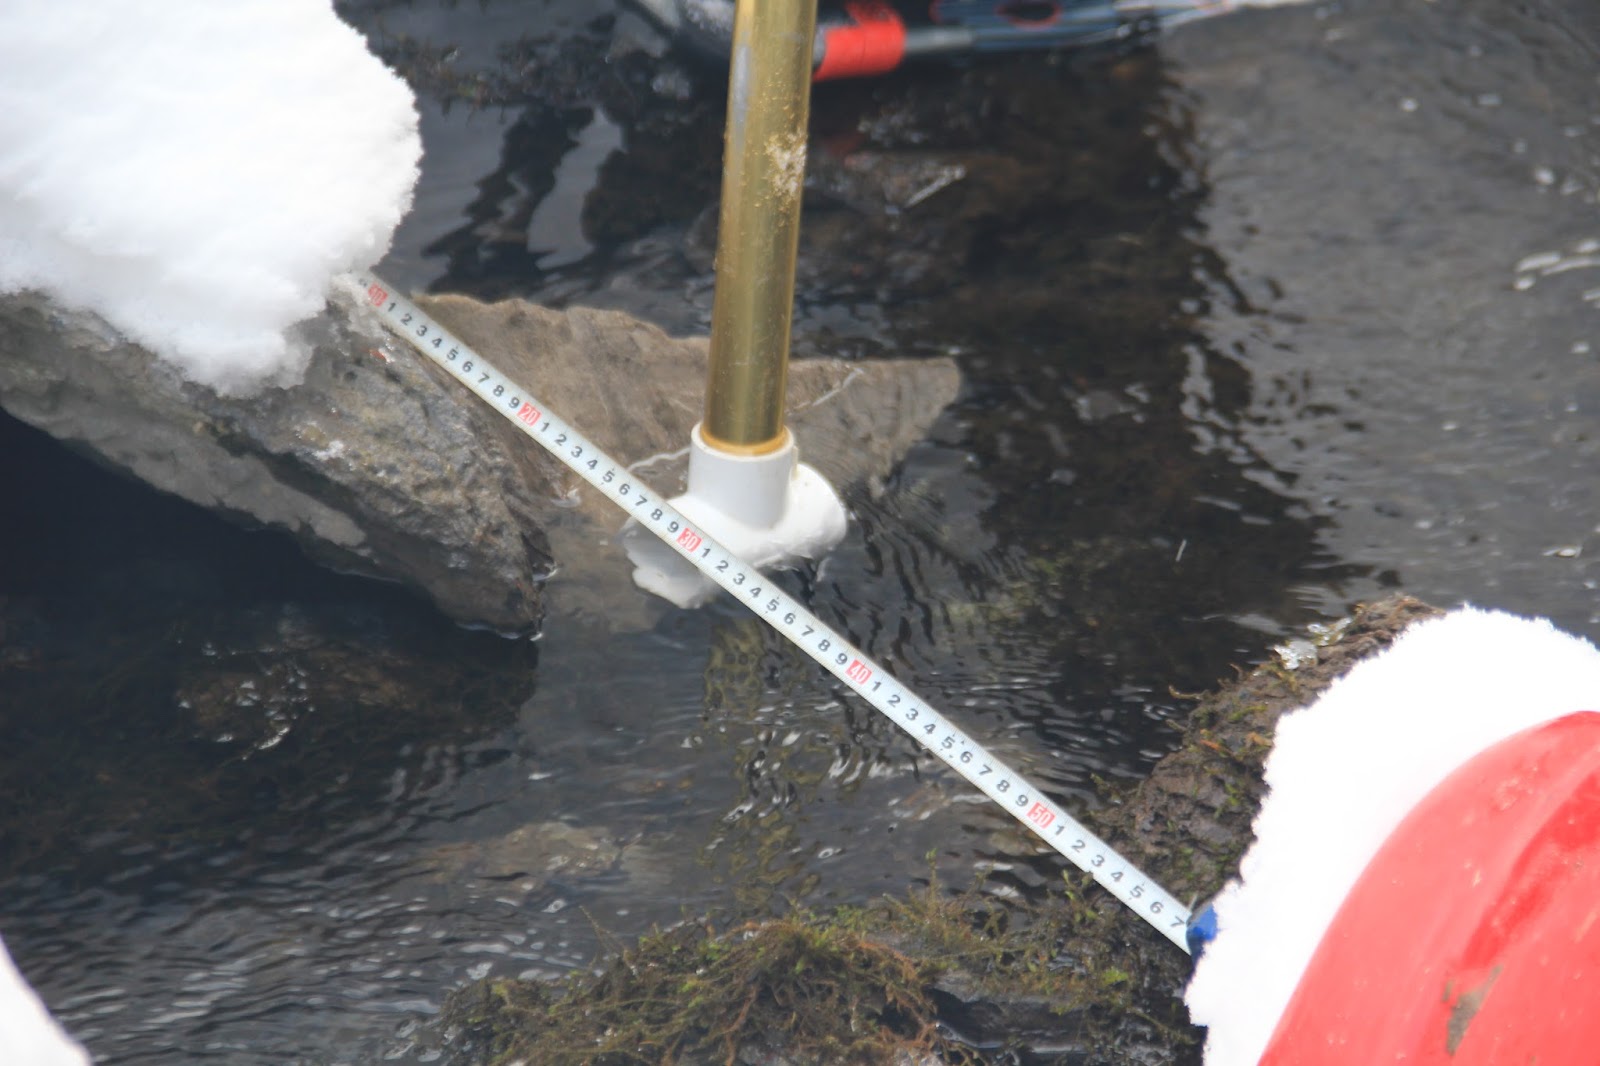
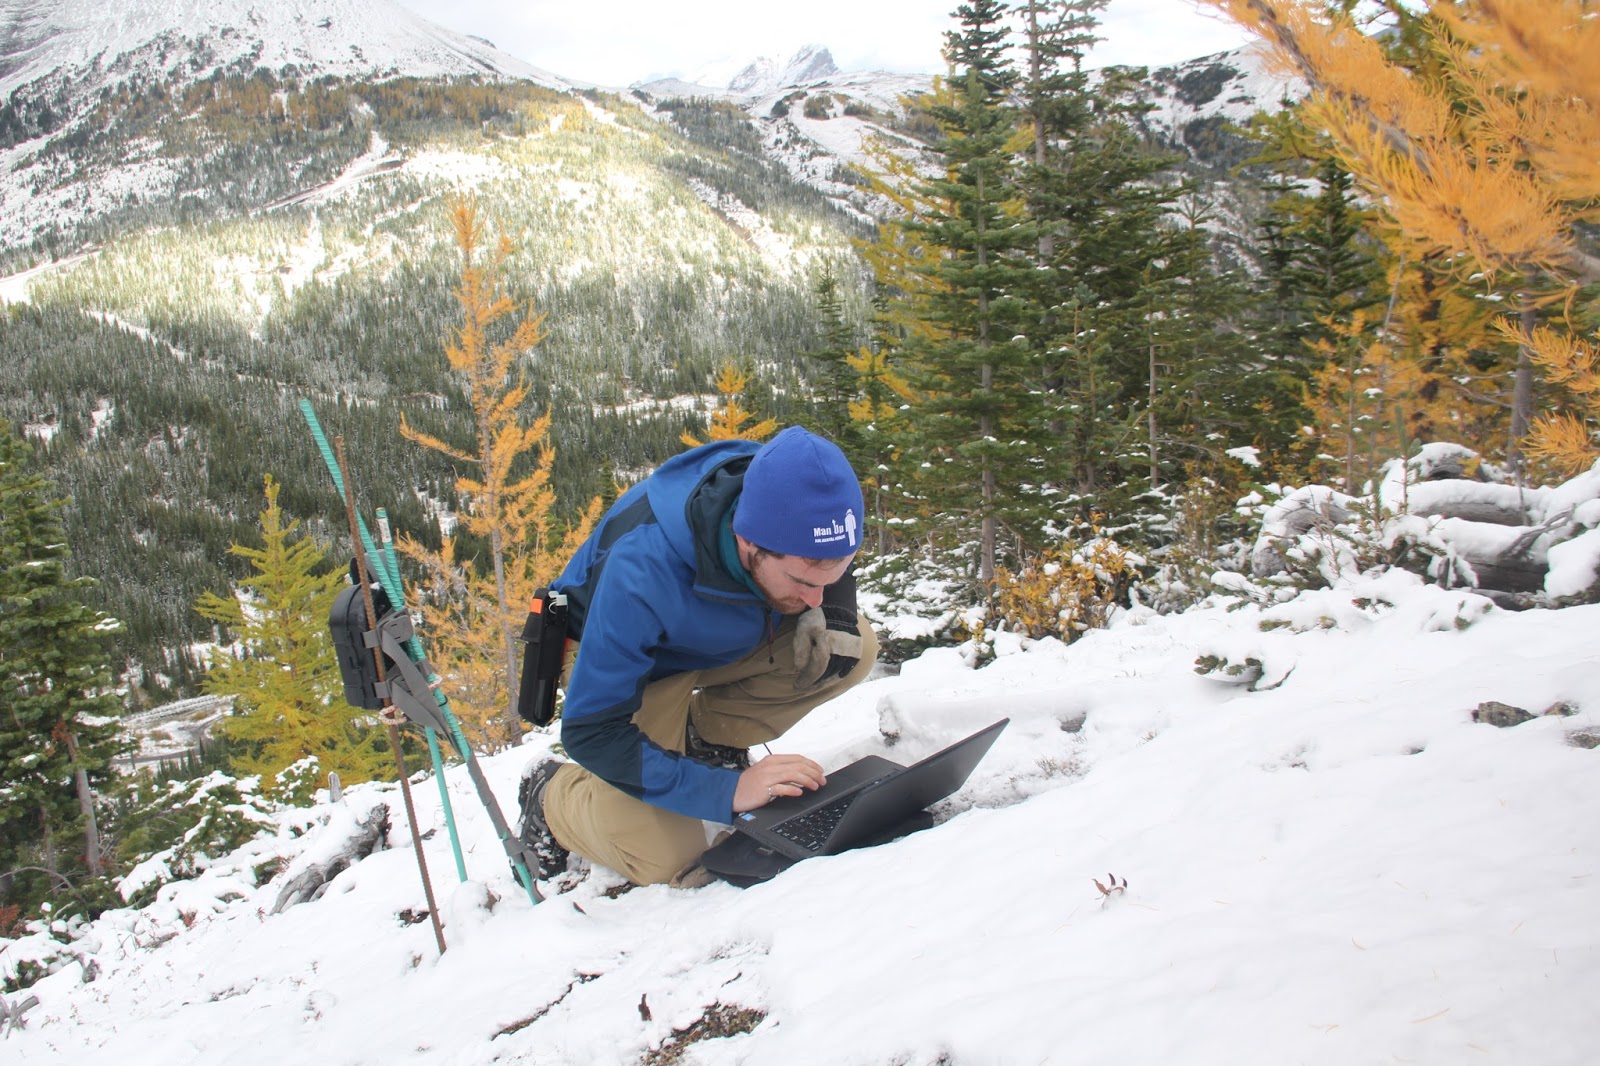
February 2017 field visit 

I took a quick jaunt up to the field on February 21 with my supervisor, Dr. Masaki Hayashi. It was an easy and pleasant day spent doing some quick field reconaissance, which we hadn't ever had the time to do in the winter. Some of the springs we were hoping to look at were covered by metres of snow, but we managed to gauge the larger spring at the north end of the study site. After a few months in the office writing and crunching numbers, it was great to get outside.
A view, looking south, and the headwall bordering my study site
Yours Truly
My supervisor, Masaki Hayashi

We found the main spring at my study site still flowing

Getting ready to measure stream flow


 Article for the CSEG Recorder

I was invited to write a short piece in for the Canadian Society of Exploration Geophysicists in the April issue of their magazine, the CSEG Recorder. My study, which uses geophysics in an alpine setting for hydrological applications is well outside what most CSEG members are used to dealing with, so it was nice to describe how I use geophysics in my little niche. The article is only available to members for the first 4-5 months after release. If you're not a member, here's a short abstract to whet your appetite: 

Scanning Calgary’s ‘Water Towers’: Applications of Hydrogeophysics in Challenging Mountain Terrain
Craig W. Christensen, Masaki Hayashi, Laurence R. Bentley
The University of Calgary, Department of Geoscience

Alpine zones provide critical water storage for drier lowland areas like the Canadian Prairies. Groundwater plays an important role by helping delay the release of snowmelt to surface streams, but these storage processes have only recently been studied and are not yet completely understood. Traditional methods for hydrogeological investigations are not usually logistically possible. Geophysics offers a low-cost alternative, and is useful for obtaining high-resolution datasets with large coverage. This article, using example data from our most recent project, illustrates how our research group uses geophysics to study mountain groundwater storage processes.

We emphasize three key lessons from our alpine studies that other practitioners of hydrogeophysics may also find enlightening. First, while logistically challenging, geophysics is an effective preliminary investigation tool for hydrogeological problems where direct sampling is not possible. Second, surface observations and supporting measurements are key to making effective interpretations. Finally, while some ambiguity may be unavoidable, using multiple geophysical methods that sample independent geophysical parameters greatly reduces the uncertainty in our final interpretations.

Interesting Data Plots

Many of the last months have been spent manipulating, plotting, and interpreting my data. Here are a few interesting ones worth sharing. 

First up, here's a 3D view of my resistivity cross-sections in the talus deposits at the south end of my site. You'll notice generally that the resistivity in the near surface is very high (10,000-30,000 Ωm), and generally decreases going down. There are places where we have more conductive material at surface (500-3,000 Ωm) corresponding to springs at surface (the blue dots below). Hence, I suspect that the green parts of the image are places with higher water content. There's also a especially high resistivity anomaly on the left side of the image in the shade that I suspect is permafrost. 


Resistivity cross-sections in the talus. The letters above stand for "West Cone", "Central Cone", and "Upper East Cone." The blue spheres indicate the locations of springs. 

I also tried out some ways of visualizing both my resistivity and seismic velocity data together. Below is the result of something called "fuzzy k-means clustering." Basically, this is an algorithm that takes a dataset, and tries to group it into meaningful groups that would not be obvious looking at just one variable at a time. In the first plot below, I plotted up all of the locations where I had overlapping resistivity and p-wave velocity, and grouped them into 7 different groups. After grouping them, I coloured these locations in my 3D model (second plot below) according to which group each point belonged to. 

While it's neat to look at, the method doesn't enhance my interpretation much because there's only one group of very high resistivity and high velocity material that is particularly distinct in this data set. Also, values below 100 Ωm are significant for my study because they are usually wet, saturated material, but that sort of geologic intuition isn't built into the method. Still, it's a neat method that is probably useful in other contexts


Sunday 25 September 2016

(Final?) Day of field work - September 19, 2016

This past week, I finished what I hope is my final day in the field for my MSc thesis project. Our mission on Monday was to collect all our remaining sensors and data from the field, as well as auger a auger to a layer underneath the meadow that was imaged by the geophysics but difficult to interpret. The augering was messy and in the end not very successful; out target was at about 6 m below surface, but we did not get past 4 m deep. However, despite the slurry of mud that we got covered in, all the other data download went off without a hitch, and we were treated beautiful eye candy all day. There was a dusting of snow over the whole valley that morning, and the larch trees with their yellow, autumnal needles added a dazzling and vibrant element to the landscape. We may have looking like messy ogres by the end of the day, but we were treated to beautiful panoramas throughout.

A big thanks to Jen Hanlon and Polina Abrakhimova for helping me out in finishing off my field work!

For these coming weeks, I'm focussing on finalizing my inversion images and doing a proper depth conversion of my GPR data. Then the final interpretation on writing begins...
Downloading some time-lapse photos

A view of the valley on this cool September morning

Jen

Polina

Me

Happy to have a big truck to drive around this site

Some of my models of the subsurface based on 2015's resistivity and seimic refraction measurements. The black line shows the target of our digging.
This wet sloppy mess got all over us (but thankfully not on the camera.) With the sidewall collapsing and the suction on our auger so strong, we gave up after 4 m. 

A dried up Bonsai Lake in the background

In some places, where there is water in the lakebed, it just disappears into small openings in the clay. 

Polina points out some other places where there are holes in the clay layer where water might be seeing in to. 

On June 28, the water was almost at the top of this stilling well. Where'd the lake go?